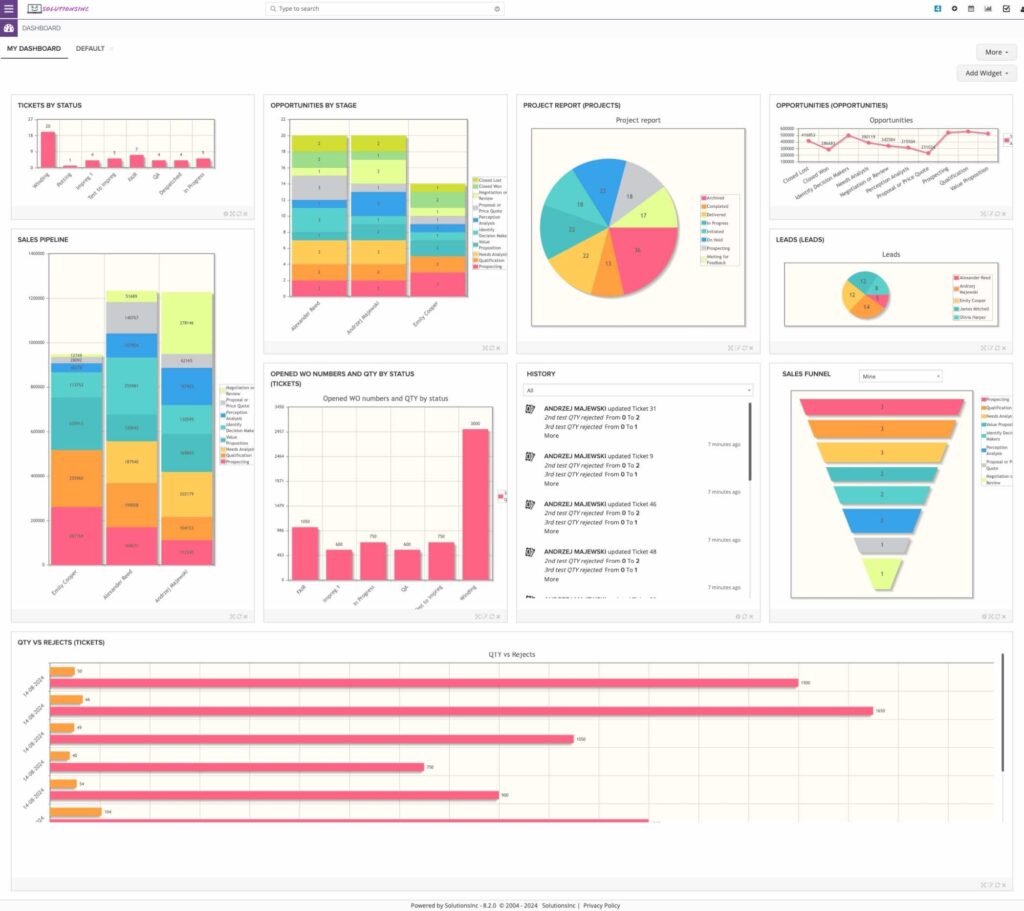
The Reports module in SolutionsInc offers businesses a powerful way to analyse, track, and visualize every aspect of their operations. From sales and employee performance to financial trends and inventory management, this module empowers you to generate detailed reports and charts that provide a clear understanding of how your business is performing. With real-time data and customizable reporting options, you can transform raw data into actionable insights that help drive growth, optimize resources, and improve decision-making across all departments. Below, we explore how the Reports module can enhance your business intelligence and operational efficiency.
Detailed Reports on Every Aspect of Your Business
The Reports module allows you to create comprehensive reports that cover every key area of your business. Whether you need to analyse customer behaviour, monitor sales trends, or track production efficiency, this tool gives you the ability to pull in data from all other modules in your SolutionsInc system. You can create reports that focus on specific aspects like marketing performance, product sales, inventory levels, or employee productivity, ensuring that you have a complete view of your company’s operations.
These reports help you identify patterns, discover areas for improvement, and monitor progress toward business goals. With data-driven insights at your fingertips, you can make more informed decisions that improve efficiency, profitability, and customer satisfaction.
Customizable Charts and Visualizations
The Reports module also includes robust charting and visualization tools, allowing you to transform complex data into easy-to-understand visuals. You can choose from a variety of chart types, including bar graphs, pie charts, line graphs, and more, to represent your data in the most effective way. Customizable filters and parameters ensure that your charts are tailored to meet your specific reporting needs, providing clear visual insights into business performance.
These visualizations are especially valuable for presenting data to stakeholders, whether in internal meetings, client presentations, or performance reviews. With clean, professional-looking charts, you can communicate complex information more effectively, helping your team and partners make sense of critical business data.

Real-Time Data for Up-to-Date Insights
In fast-moving industries, having access to real-time data is crucial for staying ahead of the competition. The Reports module offers real-time reporting, meaning you can access the most current information about your business whenever you need it. This feature enables you to respond to changes in the market, customer behaviour, or internal processes immediately, without waiting for delayed reports or outdated data.
By relying on real-time insights, you can make faster, more accurate decisions, whether it’s adjusting inventory levels, reallocating resources, or launching new marketing campaigns.
Custom Reporting for Specific Business Needs
Every business has unique needs, and the Reports module is designed to accommodate those requirements with fully customizable reporting options. You can create tailored reports that focus on specific metrics or KPIs, filter data by timeframes or categories, and drill down into detailed aspects of your operations. The flexibility of this module ensures that you get the exact information you need, in the format that works best for you.
For businesses with complex operations, this level of customization allows for greater precision in tracking performance and identifying opportunities for improvement.
Automating Report Generation
The Reports module also supports automated report generation, allowing you to schedule reports to be created and sent at regular intervals. Whether it’s daily, weekly, or monthly, you can ensure that key stakeholders receive up-to-date reports without the need for manual intervention. This automation saves time, reduces the risk of errors, and ensures that critical data is always available when it’s needed.
Integration with Other Modules
One of the biggest advantages of the Reports module is its ability to pull data from all other SolutionsInc modules, including Sales, Inventory, Projects, Employees, and more. This integration ensures that your reports are comprehensive and cover every aspect of your operations. By having all your business data in one place, you can create holistic reports that offer a complete picture of your company’s performance.
For example, you can combine sales data with employee productivity reports to identify how staffing levels impact sales, or you can link marketing reports with customer behaviour analytics to refine your campaigns.
Conclusion: Harness the Power of Data
The Reports module in SolutionsInc is an essential tool for businesses looking to make data-driven decisions and gain a deeper understanding of their operations. By offering detailed, customizable reports and real-time insights, this module ensures that you always have access to the information you need to grow and optimize your business. Whether you’re tracking sales performance, analysing market trends, or monitoring employee efficiency, the Reports module provides the tools you need to stay competitive and make smarter business decisions.