Reports & Analytics.
See the truth

while it is still fresh.



Turn live ERP data into financial statements, sales insight, and executive dashboards — without rebuilding spreadsheets every Monday.
SolutionsInc Reports & Analytics combines built-in ERPNext reports with optional Frappe Insights — charts, filters, and shared dashboards your leadership team can trust.
Start free trial

P&L · FY 2026
Net margin: 18.2%
Know profit, cash, and who
still owes you.
Run Profit & Loss, Balance Sheet, Cash Flow, and General Ledger with filters by period, cost centre, project, or currency. Accounts Receivable includes ageing and payment-term breakdowns.
 Compare periods and entities Multi-year P&L, consolidated group statements, and financial ratios (liquidity, leverage, returns).
 Act before cash dries up See overdue receivables by bucket — chase the right customers, not everyone at once.

Business Benefit: Owners make decisions on audited-grade numbers already in ERP — not a stale export from the bookkeeper.
Build live dashboards with
 Frappe Insights.

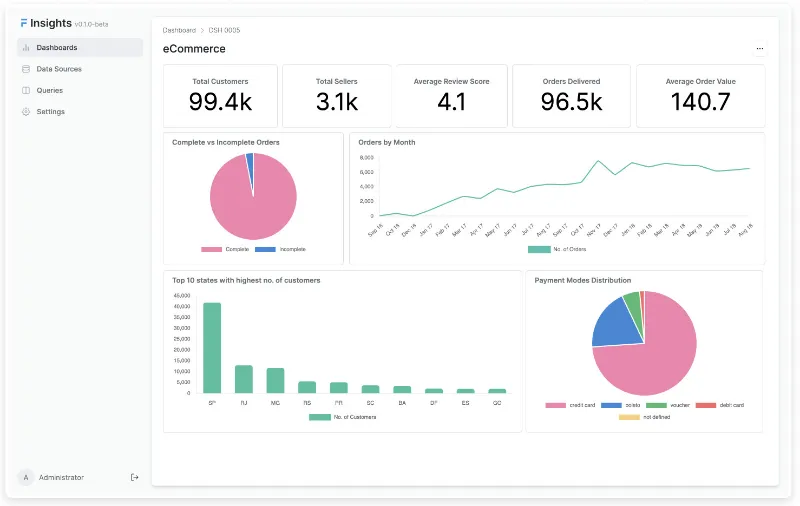
Connect ERP tables in a Query Builder, create charts (KPIs, trends, breakdowns), and arrange them on shared dashboards with filters that update every chart at once.
 One screen for leadership Revenue, orders, categories, regions — the story your board actually wants, not fifty tabs in Excel.
 Share with the team Publish dashboards internally so sales, ops, and finance work from the same live metrics.

Business Benefit: Replace “can you pull that report again?” with self-service analytics on data that updates as transactions are posted.



“Great dashboards start with clean books. Every chart in Reports & Analytics reads from transactions posted in Accounting — get the ledger right, and your P&L, ageing, and ratios tell the real story.”
Explore Accounting
Create reports in minutes,
no developer required.


Report Builder lets managers pick fields from any DocType (invoices, orders, stock moves), set filters and sorting, save the layout, and export to Excel — ideal for operational teams who need a bespoke view today.
 Adapt as processes change Add a new custom field on a form? Include it in tomorrow’s report without a change request to IT.
 Complement standard reports Use built-in script/query reports for complex logic; use Report Builder for fast tabular lists.

Business Benefit: Departments stop maintaining shadow spreadsheets that diverge from ERP.
Track sales performance and
conversion.
Sales Analytics combines charts and drill-down tables with dynamic filters. Sales Funnel shows Leads → Opportunities → Quotations → Customers. Invoice Trends and item-wise registers reveal what actually sells.
 Spot pipeline leaks Many quotes but few orders? The funnel shows where prospects drop off — fix selling, not just marketing spend.
 New vs loyal customers Acquisition & loyalty reports split revenue so you know whether growth is repeat business or new wins.


Business Benefit: Sales and leadership align on the same CRM-backed numbers — not three versions of the pipeline in email.


Catch overspend and export
when you need to.


Budget Variance compares planned vs actual spend by cost centre. Sales / Purchase Registers break out VAT by line. Export any report to Excel or Google Sheets for advisers — while keeping ERP as the source of truth.
 Monthly / quarterly control See variance early in the period — not only when the year-end accounts land.
 Module reports everywhere Stock, manufacturing, projects, and HR each ship dedicated analytics — one platform, many angles.


Business Benefit: Finance and operations share one dataset — fewer reconciliation meetings and fewer “which number is correct?” debates.

Analytics works better
on connected data.
Every module feeds the same database — reports reflect sales, stock, projects, and payroll in one place.